By consolidating fragmented pension schemes into megafunds, Rachel Reeves hopes to channel billions into UK infrastructure, housing and energy transition...
Report

|
Tom Parker |
With funds finally knowing their destinations, the LGPS pooling landscape has been transformed. We analyse the AuM figures, regional shifts and strategic plays that define the new pecking order
Well, it’s here. After months of rumours, wicked whispers, and smiling faces in press releases, finally we know which fund is headed where (or at least where the funds would prefer to go!!), and we can start to get a vague understanding of how the pooling market will shape out as we enter 2026.
But who holds the balance of power in this new world? Will we have major regional players? And who are the big winners in this new climate?
When pooling first came into existence, there was at least a vague attempt to regionalise which fund went where, and while the government didn’t mandate strict boundaries – geography did play a significant role in how the pools were formed.
This was initially driven by existing relationships – meaning funds had compatible operational practices and investment philosophies. This often meant they aligned with those from similar regions.
For example, Border to Coast – barring a few notable exceptions – found its home in the north east, while LGPS Central has its footing in the Midlands, Brunel in the west and south west, and ACCESS in the east and south east.
Now of course by the very make-up of the pools disappearing, the remaining pools are going to become more fragmented – but there is at least a degree of regional consistency across the board.
Border to Coast’s east of England make-up has continued thanks to it taking on board funds exclusively at ACCESS, with it taking on board the likes of Essex, Kent, Cambridgeshire, and the two Sussex’s. This is only somewhat broken up by Suffolk and Norfolk – both of whom are heading to LGPS Central.
Given this, it won’t surprise you to learn that LGPS Central’s make up is much more disparate – with it taking on board of the aforementioned Norfolk and Suffolk, as well as the likes of Hampshire, Wiltshire, and Gloucestershire – a far cry away from its powerbase in the West Midlands, Leicestershire and Derbyshire.
By contrast, LPPI – which has had, to this point, taken a slightly more disparate make up – has become a tad more interconnected, thanks almost exclusively to it taking on board several of Brunel’s funds based in the south west, including Cornwall, Devon and Dorset.
Figure 1: Geographical makeup of investment pools pre and post fund announcements
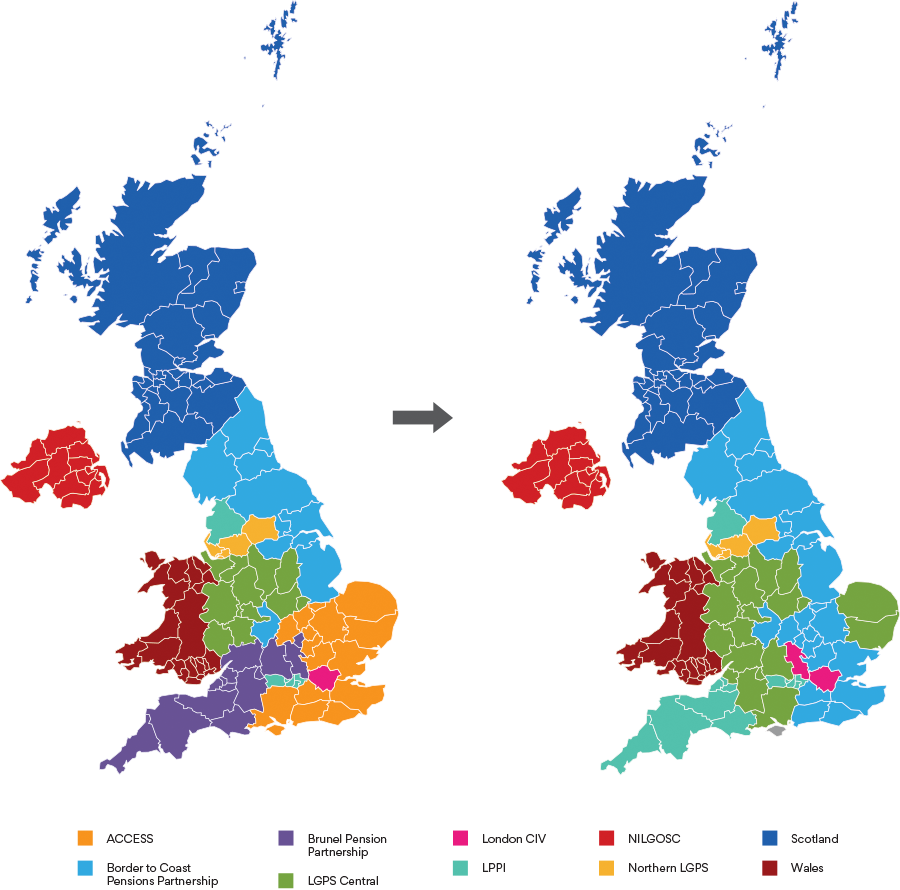
Source: Asset values at Mar 24 | www.lapfdataservices.com
I write winners as if there was a bun fight across all the pools, and whoever came out on top got all the golden goose eggs – from my understanding, and from the conversations I have had with people in the industry, it was far more harmonious and closer to there being an understanding of how strategically aligned the funds were to each of the pools.
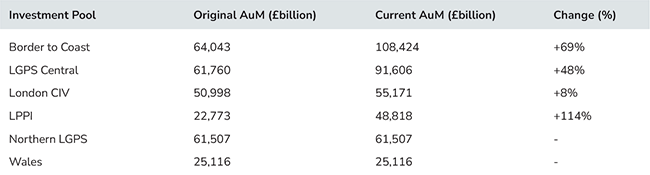
Who have emerged as the “big players” from this period of transition? Well, it’s very much dependent on how you decide to deconstruct the numbers, but there are two that loom large above the rest.
Pre-consolidation (when basing this analysis on the number of assets under management (AuM) at least) most of the funds were a bit of a much of a muchness, although four were fairly evenly matched – ACCESS, Border to Coast, LGPS Central, and Northern LGPS – all sitting in and around the £60 billion AuM figure.
This has now changed dramatically, with LGPS Central and, notably, Border to Coast galloping ahead of the rest of the field – with the pair soon to have £92 billion and £109 billion worth of AuM by the time March 2026 rolls around.
Indeed the pair have, between them, taken on funds with more than £70 billion worth AuMs. This includes two major funds from ACCESS – Hampshire and Essex, with the former’s £10 billion heading off to LGPS Central, and the latter’s £11 billion being taken on by Border to Coast.
We did, however, start this section by asking who the big winners of pooling consolidation were – and it could be argued that this accolade could fall at the feet of LPPI.
Figure 2: LGPS Investment Pool AuMs (billion)

Source: Asset values at Mar 24 | www.lapfdataservices.com
Prior to the consolidation process, LPPI did have the lowest number of both funds and AuM (although it does have to be said the £22.7 billion figure cannot be sniffed at).
Post Fit for the Future this has, somewhat, turned on its head.
The pool has now brought six new funds into the fold, and – at £49 billion – has more than doubled its AuM standing, only marginally behind London CIV – itself rather unexpectedly increasing the count of clients by one when Buckinghamshire declared for the London pool.
Figure 3: LGPS Investment Pool AuMs pre- and post-pool announcements
Source: Asset values at Mar 24 | www.lapfdataservices.com
So while the landscape has shifted, the pecking order hasn’t been completely rewritten. Border to Coast and LGPS Central have cemented their positions as the heavyweight champions of the pooling world, while LPPI’s impressive growth story shows that strategic expansion – rather than just scale – can deliver real momentum.
What’s clear is that the regional flavour of pooling, while diluted, hasn’t disappeared entirely. And as we head into 2026, the question isn’t so much about who won this round of consolidation, but rather how these newly configured pools will deliver on the promises that made them necessary in the first place: better returns, lower costs, and more efficient governance for the funds they serve.
The pieces are now in place. The real test begins when the music stops and the performance numbers start rolling in.
Figure 4: Preferred pool moves announced by pension funds
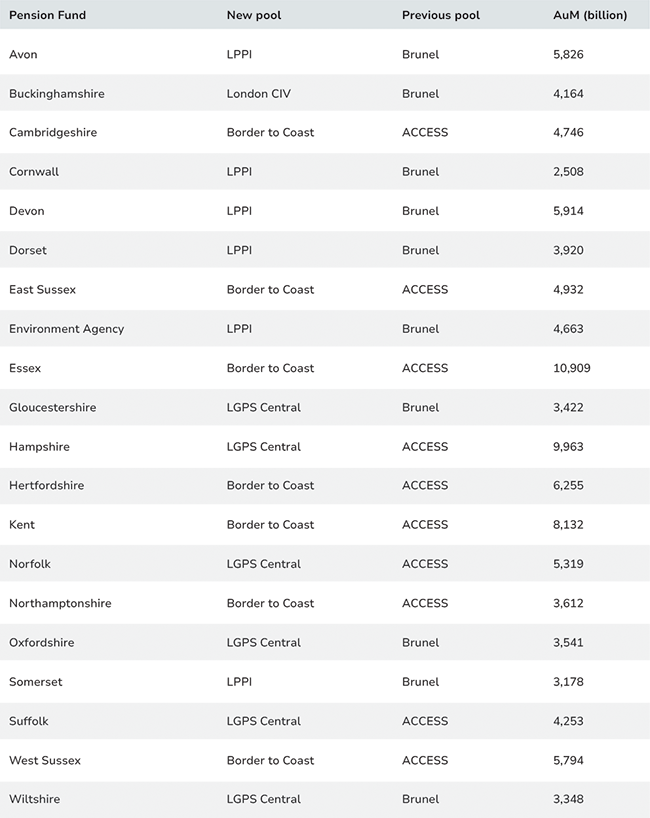
Source: Asset values at Mar 24 | www.lapfdataservices.com
|
|
|