The catalysts set to drive frontier markets
Written By:

|
Oliver Bell |

|
Paul Gallagher |
Elections, MSCI reclassifications and political change poised to make an impact. Oliver Bell and Paul Gallagher of T. Rowe Price delve into the issues
While frontier markets experienced a challenging 2018, we have identified three catalysts that potentially could drive a turnaround in performance in 2019. The global economy presented headwinds last year, but the low correlation of the asset class with the global cycle meant that it was often country-level political and economic developments that weighed on frontier markets the most.
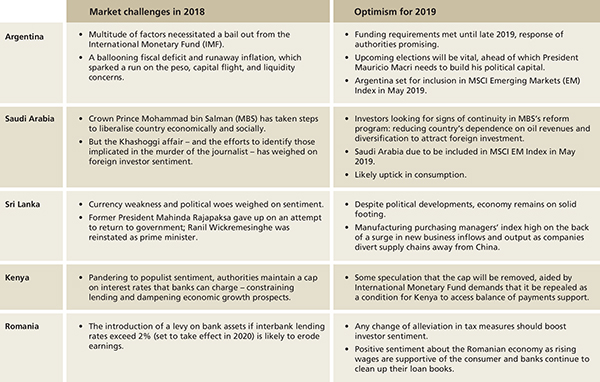
In 2018, Argentina was mired in a crisis, Saudi Arabia struggled with foreign investor perceptions, Sri Lanka faced a leadership vacuum, and harmful tax measures in Kenya and Romania took a toll on their respective financial sectors. As these issues are addressed or fade, 2019 could present a silver lining.
Catalysts set to drive markets
Adopting a broad, overarching view, we have identified three factors that have the potential to drive improved frontier market performance in 2019: elections, MSCI reclassifications, and geopolitical and trade developments.
Key elections in the pipeline
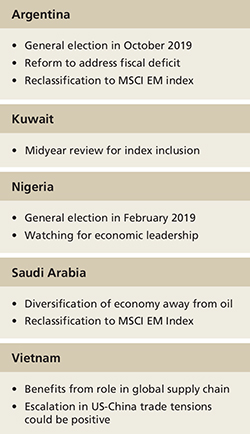
Argentina is set for a crucial general election in October 2019, with President Mauricio Macri likely to run for reelection. If Macri wins and obtains control of the lower house, the pace of reform can meaningfully accelerate. While the crisis has dented his popularity, it is possible that the timing of the election will coincide with resurgent growth.
Figure 1: Key developments in frontier market economies

As of January 31, 2019
It is uncertain who will contest Macri in the election, with some speculation that former President Cristina Kirchner would run (20% probability) – and her victory would be overwhelmingly market unfriendly, bringing with it the potential reintroduction of capital controls. If Macri is reelected, however, this would be a positive catalyst for the asset class, as he is highly likely to continue broad‑based fiscal adjustment.
Nigeria headed to the polls in February. Incumbent President Muhammadu Buhari of the All Progressives Congress ran against former Vice President Atiku Abubakar of the People’s Democratic Party, winning with 56% of votes. With the country emerging from recession, economic leadership is at stake. Continuity should be a positive sign, as the naira is at a more appropriate level, the minimum wage has increased, and both oil and non-oil sectors are making gains.
From here we watch for a stronger government focus on economics and the convergence to one exchange rate. Investors would likely welcome more market-driven policies, and the introduction of measures to boost domestic business and investment.
MSCI reclassifications
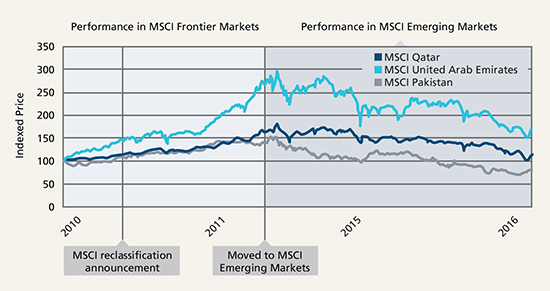
Countries shifting from the frontier to the emerging markets universe are likely to attract inflows ahead of index inclusion, as we have seen in the case of Qatar, the United Arab Emirates, and Pakistan in the past.
Figure 2: Catching the reclassification rally

Past performance is not a reliable indicator of future performance.
Source: MSCI, Financial data and analytics provider FactSet. Copyright 2019 FactSet. All Rights Reserved. As of January 31, 2019. Qatar and the United Arab Emirates were reclassified in May 2014. Pakistan was reclassified in May 2017. The data are rebased to 100 for comparison and are for illustrative purposes only. MSCI makes no express or implied warranties or representations and shall have no liability whatsoever with respect to any MSCI data contained herein. The MSCI data may not be further redistributed or used as a basis for other indices or any securities or financial products. This report is not approved, reviewed, or produced by MSCI.
Argentina and Saudi Arabia are set for inclusion in May 2019. Kuwait, which has already been upgraded by index provider FTSE, is due to be reviewed midyear by MSCI (for inclusion in 2020) and looks set to meet the criteria for inclusion.
Markets that are upgraded are typically subject to significant inflows ahead of inclusion, as passive fund investors look to fill quotas in accordance with the new weightings. This tends to benefit existing investors, and our approach is to gain exposure to this trend and gradually reduce our holdings after index inclusion if valuations have become too stretched through the process.
Geopolitical and trade developments
Investors are watching the trade tensions between the U.S. and China closely, waiting to see if tariff barriers are raised further. If these tensions ease, investor risk appetite should pick up, benefiting frontier markets.
However, countries such as Vietnam and Bangladesh, because of their role in the global supply chain, stand to benefit from ongoing tensions, as companies look to shift production away from China and are attracted by the cheap labour on offer. Vietnam, for its size, is disproportionately geared into the global economic cycle due to its large export market.
Figure 3: What to watch in frontier markets in 2019

As of January 31, 2019
Diversify your portfolio risk
Frontier markets consist of some of the fastest growing economies globally. The group as a whole is expected to outpace emerging markets and significantly outpace developed markets in terms of GDP growth through the rest of this decade, and likely beyond.
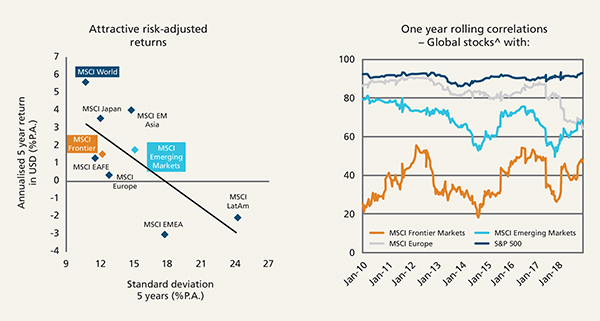
Interestingly, frontier markets have significantly outperformed emerging markets and most developed market regions on a risk-adjusted basis over the past five years, while exhibiting lower standard deviation than these asset classes. Efficient frontier analysis confirms the benefit of including an allocation to the asset class. While investors should still expect some volatility, in a portfolio context one of its key attributes is a very low level of correlation with other markets and therefore other asset classes, thereby offering significant diversification benefits.
Frontier economies are at an earlier stage of development, and in most cases are not tied into global manufacturing supply chains, meaning they are less impacted by global cycles. Even though frontier’s correlation with global stocks has increased over the last couple of years, it still remains very low.
Furthermore, correlations between frontier countries themselves are extremely low at, on average, around 0.05 for the top 10 frontier markets versus 0.45 for the top 10 emerging markets, resulting in much lower than expected correlations and volatility.
As we continue to see improvements in political and economic indicators, we expect frontier markets to grow significantly in terms of market representation. By making at least a small allocation to frontier today and staying invested in what are predominantly long-term investment opportunities, we believe investors can potentially achieve strong investment returns as companies and economies grow quickly from a very low base. While there may be pockets of volatility, the longer-term direction of travel looks attractive.
Figure 4: A less volatile, uncorrelated asset class

Past performance is not a reliable indicator of future performance.
Source: MSCI data: MSCI. MSCI makes no express or implied warranties or representations and shall have no liability whatsoever with respect to any MSCI data contained herein. The MSCI data may not be further redistributed or used as a basis for other indices or any securities or financial products. This report is not approved, reviewed, or produced by MSCI.
FactSet. ^Global stocks are represented by the MSCI AC World Index.
Conclusion
In our view the outlook for frontier markets should continue to improve as several of the country‑level developments weighing on markets resolve. With much of this already reflected in asset prices, markets are potentially primed for an improvement in sentiment as elections, MSCI reclassifications, and trade and geopolitical developments play out over the year.
Important Information
S&P Indices are products of S&P Dow Jones Indices LLC, a division of S&P Global, or its affiliates (“SPDJI”), and have been licensed for use by T. Rowe Price. Standard & Poor’s® and S&P® are registered trademarks of Standard & Poor’s Financial Services LLC, a division of S&P Global (“S&P”); Dow Jones® is a registered trademark of Dow Jones Trademark Holdings LLC (“Dow Jones”) and these trademarks have been licensed for use by SPDJI and sublicensed for certain purposes by T. Rowe Price. T. Rowe Price is not sponsored, endorsed, sold or promoted by SPDJI, Dow Jones, S&P, their respective affiliates, and none of such parties make any representation regarding the advisability of investing in such product(s) nor do they have any liability for any errors, omissions, or interruptions of the S&P Indices.
This material is being furnished for general informational purposes only. The material does not constitute or undertake to give advice of any nature, including fiduciary investment advice, and prospective investors are recommended to seek independent legal, financial and tax advice before making any investment decision. T. Rowe Price group of companies including T. Rowe Price Associates, Inc. and/or its affiliates receive revenue from T. Rowe Price investment products and services. Past performance is not a reliable indicator of future performance. The value of an investment and any income from it can go down as well as up. Investors may get back less than the amount invested.
The material does not constitute a distribution, an offer, an invitation, a personal or general recommendation or solicitation to sell or buy any securities in any jurisdiction or to conduct any particular investment activity. The material has not been reviewed by any regulatory authority in any jurisdiction.
Information and opinions presented have been obtained or derived from sources believed to be reliable and current; however, we cannot guarantee the sources’ accuracy or completeness. There is no guarantee that any forecasts made will come to pass. The views contained herein are as of the date written and are subject to change without notice; these views may differ from those of other T. Rowe Price group companies and/or associates. Under no circumstances should the material, in whole or in part, be copied or redistributed without consent from T. Rowe Price.
The material is not intended for use by persons in jurisdictions which prohibit or restrict the distribution of the material and in certain countries the material is provided upon specific request. It is not intended for distribution to retail investors in any jurisdiction.
UK – This material is issued and approved by T. Rowe Price International Ltd., 60 Queen Victoria Street, London, EC4N 4TZ which is authorised and regulated by the UK Financial Conduct Authority. For Professional Clients only.
© 2019 T. Rowe Price. All rights reserved. T. ROWE PRICE, INVEST WITH CONFIDENCE, and the Bighorn Sheep design are, collectively and/or apart, trademarks of T. Rowe Price Group, Inc.
201903-795612
More Related Content...
|
|
|


