Simplicity wins: How most conventional asset classes have outpaced inflation
Written By:

|
Mamdouh Medhat |
Mamdouh Medhat at Dimensional Fund Advisors discusses the findings of a study of 23 US assets over a 93-year period showing their relative success in protecting the purchasing power of pension benefits
Local authorities are often on the front line of public-service provision to some of the country’s most vulnerable people. As such, they have first-hand knowledge of the damage that inflation can inflict on household finances. In addition, inflation brings other longer-term challenges to local authorities, such as its corrosive effect on pension assets.
Sophisticated long-term investors have many, sometimes complex, options to choose from in the battle against inflation, and all deserve some consideration. Nonetheless, our study of inflation and global asset returns highlights that if you are clear about your goals in the fight against inflation, even conventional investment strategies can protect the purchasing power of pension benefits.
Our study found that simply staying invested in long-term defensive and growth assets has historically outpaced inflation. Furthermore, if you are particularly sensitive to unexpected inflation, our findings suggest that instruments and strategies specifically designed to hedge against inflation make the most sense.
Sticking with conventional assets has beaten inflation
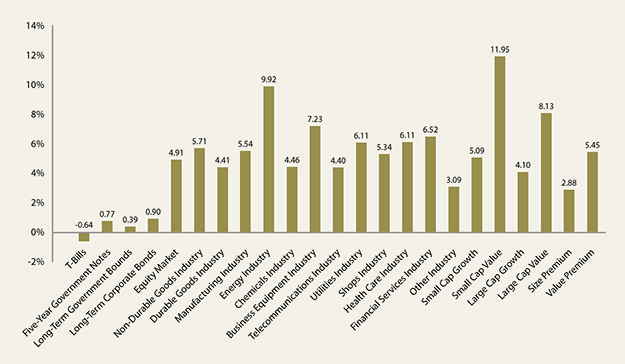
In our study, we consider a total of 23 US assets that span bonds, stocks, industries, and equity premiums over 1927-2020. Figure 1 shows average real returns (net of inflation) to the different asset classes in years with high (above-median) inflation.
Over this period, inflation averaged 5.5% per year in high-inflation years. While average real returns were mostly lower in years with high inflation compared to years with low inflation, Figure 1 shows that all assets except one-month Treasury bills had positive average real returns in high-inflation years.
We use US data because it allows for the longest possible sample period, but US inflation trends are comparable to those in the UK. The sample over 1927-2020 is particularly useful because it covers periods with double-digit inflation (like the 1940s and ‘70s) as well as periods with negative inflation or deflation (like the Great Depression, 1929-32). But we find similar results over the most recent 30-year period (1991–2020), when US inflation was relatively mild and stable. Over this period, we also expand our analysis to non-USD bonds, developed- and emerging-market equities, real estate investment trusts (REITs), and commodities. Overall, outpacing inflation over the long term has been the rule rather than the exception among the assets we study.
Figure 1: Average annual real returns in years with above-median US inflation, 1927–2020

Past performance is no guarantee of future results
Indices are not available for direct investment, therefore their performance does not reflect the expenses associated with the management of an actual portfolio. Returns are in USD. See data appendix for more information
Hedge the unexpected
Some people build inflation protection around stocks from certain industries, REITs, commodities, or value stocks, because such assets are sometimes considered “inflation sensitive.” The data, however, provides little support that they are good inflation hedges because outpacing and hedging against inflation are very different things.
We believe that nominal asset prices already embed the market’s expectation of inflation. This explains why yields rise before inflation figures are released or the Bank of England announces its latest forecasts. So, inflation risks are really about the negative impact of unexpected inflation on the real value of your invested wealth. An asset is most useful as an inflation hedge when its nominal returns move closely with unexpected inflation.
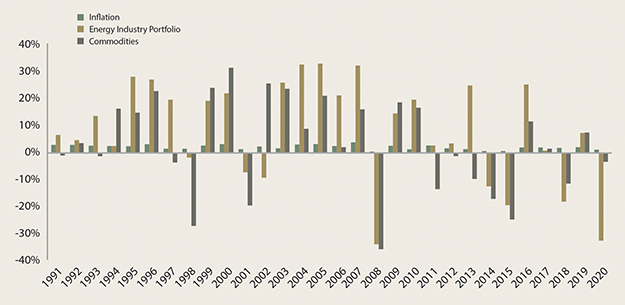
In our analysis, we find mostly weak correlations between nominal returns and unexpected inflation. For the few exceptions where the correlations are reliable, such as for “inflation sensitive” energy stocks and commodities over 1991-2020, the assets’ nominal returns have been around 20 times as volatile as inflation, and more than half of their nominal-return variation has been unrelated to inflation.
Figure 2 illustrates this by showing how the annual nominal returns to energy stocks and commodities differ dramatically from the annual realisations of inflation. If the goal is to protect future purchasing power, it is questionable that hedging with something this volatile will effectively achieve that.
The conclusion is that if you’re highly sensitive to inflation and have a low tolerance for market risk, you may want to consider inflation-indexed securities, such as index-linked Gilts or inflation swaps. They are, after all, designed to provide inflation protection.
Figure 2: Annual US inflation along with nominal returns to energy stocks and commodities, 1991–2020

Past performance is no guarantee of future results
Indices are not available for direct investment, therefore their performance does not reflect the expenses associated with the management of an actual portfolio. Returns in USD. See data appendix for more information
Inflation is persistent but asset prices are predictably unpredictable
Our study documents that inflation tends to be persistent: when prices are rising fast, they tend to continue doing so for a while before the pace slows. Asset returns, on the other hand, are unpredictable. So, even if you knew with certainty what inflation will be a year or ten from now, you know little to nothing about future asset returns.
Fortunately, this does not matter, because the data suggests that simply staying invested helps outpace inflation over the long term. And for those of us who are particularly sensitive to unexpected inflation, we believe that the protection offered by inflation-indexed securities still appears to be the most effective.
Data Appendix
US inflation: The annual rate of change in the Consumer Price Index for All Urban Consumers (CPI-U, not seasonally adjusted) from the Bureau of Labor Statistics.
US government securities and long-term corporate bonds: The returns to US government securities (one-month T-bills, five-year notes, and long-term bonds) and long-term corporate bonds are from Morningstar (previously from Ibbotson Associates).
US equity portfolios and factors: The US equity market is proxied by the Fama/French Total US Market Research Index. The US industry portfolios are the 12 Fama/French industry portfolios. The US style portfolios (small cap value and growth and large cap value and growth) are from the Fama/French six portfolios sorted on size (market cap) and book-to-market equity. The US size and value premiums are proxied by the Fama/French size and value factors. The returns to all of the above are from Ken French’s data library: https://mba.tuck.dartmouth.edu/pages/faculty/ken.french/data_library.html.
Glossary
Inflation swaps: An inflation-swap agreement is a two-sided contract in which one party receives floating payments tied to the actual inflation rate and pays fixed payments based on expected inflation and the inflation risk premium for a given notional amount and period.
Nominal return: The rate of return on an investment without adjusting for inflation.
Real return: The rate of return on an investment after adjusting for inflation.
More Related Content...
|
|
|


