Infrastructure: Achieving an optimal blend
Written By:

|
Sheridan Bowers |
Sheridan Bowers of Vontobel Asset Management analyses why infrastructure portfolios should include both listed and unlisted allocations
Over the past several decades, institutional investors have discovered and developed the global infrastructure asset class via private/direct and listed investments. While infrastructure was for many years a newly emerging investment area, it now represents a deep and diverse investable universe of circa $5 trillion dollars (£4.2 trillion).
Historically many institutional investors have favoured investments in unlisted, or direct, infrastructure versus investment in listed infrastructure securities traded on public markets. While both approaches have many positive attributes associated with them, investors that focus only on unlisted or private infrastructure may miss out on numerous compelling and complementary benefits that listed investment provides to an overall portfolio. In order to construct an optimal infrastructure portfolio, investors should consider including allocations to both listed and unlisted investment.
Defining infrastructure
As an asset class, infrastructure provides investors with an opportunity to seek stable, inflation-linked returns from ownership of physical assets in diverse sectors – including communications, utilities, transportation and energy – and can be defined as the large-scale physical assets a society needs to function and grow effectively. Infrastructure companies generally provide the public with essential and irreplaceable services, and make up the physical foundation necessary for societies to achieve sustainable economic development.
The infrastructure asset class can be divided into unlisted and listed categories, with unlisted infrastructure investment tracing its development back to the 1990s and listed infrastructure investment beginning around the turn of the millennium.
Despite its slightly shorter history, listed infrastructure investment has surpassed direct infrastructure investment in terms of investable market value. Within a current estimated investable universe of approximately $5 trillion across listed and unlisted infrastructure assets, $2.8 trillion (£2.3 trillion) of infrastructure assets fall within the listed category.¹
Benefits of listed infrastructure investment
Some investors prefer direct infrastructure investment due to certain perceived advantages, like lower volatility and cross-sector correlations, that this category provides. However, listed investment inherently provides numerous compelling and complementary benefits to an infrastructure portfolio. These benefits include:
- Attractive historical total returns
- Better diversification
- Daily liquidity and faster capital deployment
- Greater transparency
- More attractive purchase multiples
- ESG integration
Global listed infrastructure has historically offered investors attractive returns due to the stable and predictable cash flows of the underlying assets. Over the last 10 years, infrastructure has offered an average annual gross return of 9.5%, as represented by the GLIO Index, versus 9.4% for the FTSE Global World Equities Index, with only 80% of the volatility, as of February 2021.² Aside from the potential for capital appreciation, global infrastructure has historically offered almost double the income of a traditional equity and bond portfolio.³ Such yields, in turn, have attracted investors looking to supplement their fixed income allocations in a historically low interest rate environment.
While the scope of direct infrastructure investment is often comparatively limited with respect to country, sector, and asset holdings, the broad array of listed infrastructure offerings can provide better diversification in these areas and reduced concentration risk. Assets owned within the listed and unlisted categories vary between sectors within the infrastructure asset class, with some types of assets, including especially large assets, less commonly held or not held at all via unlisted vehicles.
It is evident that unlisted investors, considering concentration risk, can only allocate a limited amount of dry powder to any given infrastructure asset. Therefore, investments in assets with the magnitude of long-distance pipelines and large utilities tend to be more difficult for unlisted infrastructure investors to access. Additionally, renewable energy, water and electric utilities, and some of the world’s largest airports are accessible via listed investment in public markets. This example illustrates how an investment in listed securities can provide unique diversification opportunity within the infrastructure asset class.
Regarding deployment of capital, whereas there is typically a substantial lag time between capital raising and deployment for unlisted infrastructure investments, listed infrastructure investments can be made efficiently and instantaneously on public markets as soon as capital is available. The deep and highly regulated public markets on which developed-market listed infrastructure is traded also provide daily liquidity and high transparency to investors, in contrast to the comparatively lower liquidity and transparency that is characteristic of direct infrastructure investments. For this reason, listed infrastructure investment can be particularly beneficial to defined contribution pension schemes that require ready liquidity.
With respect to purchase multiples, unlisted infrastructure investments have generally been made at substantial premiums to listed infrastructure investments. This is due in large part to a sizable backlog of funds raised for direct infrastructure investment that has driven up private asset prices. For example, it is estimated that direct investors in infrastructure assets from 2007 to 2020, which include developed and emerging markets, have made acquisitions at average multiples of 14x year-ahead cash flows, compared with a much lower 10x average cash-flow multiple paid by investors in listed infrastructure companies during the same time period.⁴
Listed infrastructure also provides marked advantages compared to direct infrastructure in the area of ESG. In recent years, ESG has become an increasingly important factor in investment analysis and returns across asset classes, including infrastructure. Listed infrastructure companies generally have greater incentives to provide more robust and transparent ESG reporting than unlisted counterparts due to a broader and more liquid investor base, as well as higher levels of scrutiny resulting from their public-facing ownership structures. The launch of the GLIO/GRESB ESG Index for pure listed infrastructure in January 2021 is a prime example of how listed infrastructure is one step ahead of unlisted infrastructure – the index is a global first for infrastructure.
Blending listed and direct investment
Noting the complementary qualities of listed and unlisted infrastructure investment, a key question is how to blend them into an integrated infrastructure portfolio. It’s important to remember that listed infrastructure is priced daily and tends to be more volatile in the short term, since it is impacted by market movements. On the other hand, direct infrastructure investments use periodic valuations (frequently quarterly) of the underlying assets by auditor estimates which do not reflect an actual market price.
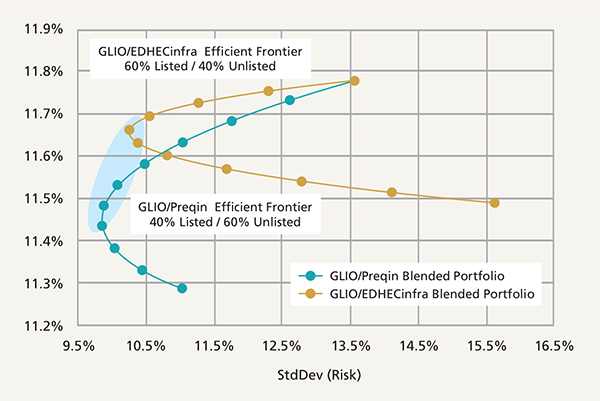
Figure 1 displays efficient frontier results blending the GLIO (Global Listed Infrastructure Organisation) Index with, respectively, the EDHEC Broad Market Index (EDHEC BMI) and Preqin USI (Prequin Unsmoothed Index) utilising optimal portfolio mixes as compiled by the Global Listed Infrastructure Organisation. The GLIO Index represents listed infrastructure and the EDHEC BMI and Prequin USI indices represent unlisted infrastructure, which includes emerging markets. In these examples, the blend between the GLIO Index and EDHEC BMI is determined to be optimal at 60% listed and 40% unlisted, while the blend between the GLIO Index and the Preqin USI is determined to be optimal at 40% listed and 60% unlisted. The highlighted section in Figure 1 shows an area of balance between the two portfolios, indicating that a 50/50 listed/unlisted infrastructure investment mix may be ideal, given assumptions inherent in these examples.⁵
Figure 1: Infrastructure blends – efficient frontiers

Source: GLIO Index Monthly Update Benchmark & Company Performance, February 28, 2021. Examples are theoretical results derived from expected values based on past data from two indices with differing and distinct characteristics. Past performance is not indicative of future results. Indices are not available for direct investment and do not reflect the deduction of fees or expenses. No assumption should be made regarding the risk or return that would be experienced by any actual portfolio. Examples are not intended to constitute investment advice and are provided for illustration purposes.
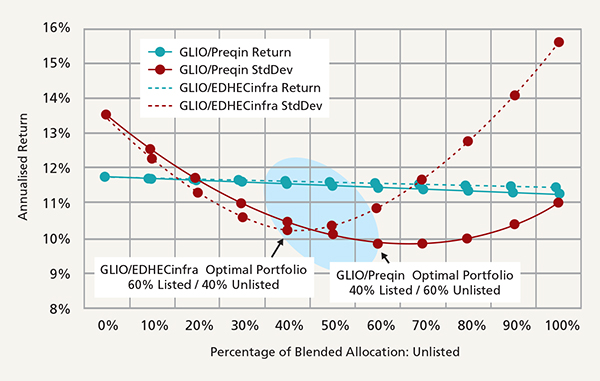
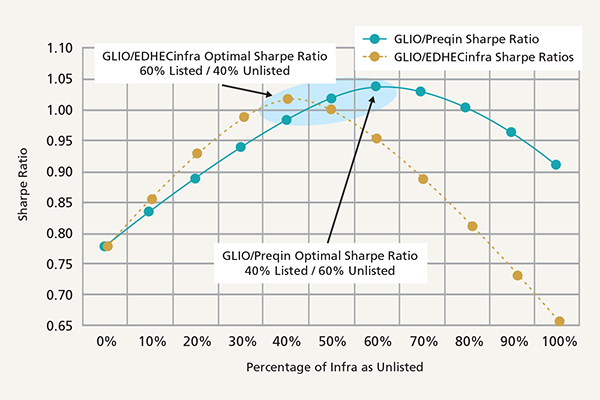
Figures 2 and 3 highlight blends in terms of return and risk, as well as with respect to Sharpe ratios⁶.
Figure 2: Blends, risk & return

Source: GLIO Index Monthly Update Benchmark & Company Performance, February 28, 2021. Examples are theoretical results derived from expected values based on past data from two indices with differing and distinct characteristics. Past performance is not indicative of future results. Indices are not available for direct investment and do not reflect the deduction of fees or expenses. No assumption should be made regarding the risk or return that would be experienced by any actual portfolio. Examples are not intended to constitute investment advice and are provided for illustration purposes.
Figure 3: Blends, Sharpe ratios

Source: GLIO Index Monthly Update Benchmark & Company Performance, February 28, 2021. Examples are theoretical results derived from expected values based on past data from two indices with differing and distinct characteristics. Past performance is not indicative of future results. Indices are not available for direct investment and do not reflect the deduction of fees or expenses. No assumption should be made regarding the risk or return that would be experienced by any actual portfolio. Examples are not intended to constitute investment advice and are provided for illustration purposes.
Conclusion
As we have discussed, listed and unlisted investment are complementary categories that can be blended to construct a foundation for building optimised infrastructure portfolios. While some institutional investors have historically favoured unlisted infrastructure investment, listed infrastructure provides compelling and differentiated advantages that investors should consider utilising. These benefits include potential attractive total returns, better diversification, more transparency, and greater liquidity.
Past performance is not indicative of future results. This material has been prepared using sources of information generally believed to be reliable; however, its accuracy is not guaranteed. Opinions represented are subject to change and should not be considered investment advice or an offer of securities. Forward-looking statements are necessarily speculative in nature. It can be expected that some or all of the assumptions or beliefs underlying the forward-looking statements will not materialise or will vary significantly from actual results or outcomes.
1. Source: Global Listed Infrastructure Organisation. As of February 26, 2021. Listed and unlisted infrastructure include both developed and emerging markets. Listed infrastructure represented by the GLIO Index.
2. To end February 2021 (26.02.2021). Past performance is not indicative of future results. Indices are not available for direct investment and do not reflect the deduction of fees or expenses.
3. Traditional US stock and bond portfolio represented by a 60% allocation to the S&P 500 Index and 40% allocation to the Bloomberg Barclays US Aggregate Index, as of 31 December 2020.
4. Global Listed Infrastructure Organisation.
5. GLIO Index Monthly Update Benchmark & Company Performance, 28 February 2021. Examples are theoretical results derived from expected values based on past data from two indices with differing and distinct characteristics. Past performance is not indicative of future results. Indices are not available for direct investment and do not reflect the deduction of fees or expenses. No assumption should be made regarding the risk or return that would be experienced by any actual portfolio. Examples are not intended to constitute investment advice and are provided for illustration purposes.
6. Ibid
More Related Content...
|
|
|


