DNA of a manager search: LGPS and infrastructure
Written By:

|
Peter Hobbs |
Peter Hobbs of bfinance looks at the challenges faced by infrastructure investors, and takes us through a case study showing how a manager search identifies investor requirements and concerns to help identify suitable managers
Unlisted infrastructure has become an increasingly significant component of UK LGPS portfolios over the past decade. Local authorities have implemented new or increased allocations, resulting in a stream of new manager searches. This activity has continued strongly through the “pre-pooling” phase of 2016-18, contrary to the predictions of some commentators who expected the community to press “pause” on illiquid investment activity while the pools developed private markets capability.
As an asset class, infrastructure continues to have hugely significant attractions as a yield enhancer, portfolio diversifier and inflation buffer. Increases in allocations are well-supported from a theoretical standpoint. Yet today’s LGPS funds, like their global peers, face an increasingly challenging and diverse opportunity set. After a stellar 15 years, there are serious challenges to overcome for investors to maintain the results that they have enjoyed in the recent past.
The risks range from aggressive pricing at a time of rising interest rates, to growing political and regulatory concerns. Managers and investors are under pressure to deploy capital and target performance in line with recent years, often succumbing to style drift as a result. The asset class is increasingly complex, while many managers present short track records and limited transparency. Infrastructure funds are tapping into niches that would not have previously been considered, such as energy storage or data centres. The average proportion of classic core infrastructure is declining. We have observed an increasing proportion of greenfield exposure in private infrastructure funds, while our research indicates that not all such teams have credible expertise in that space. Sourcing has become increasingly competitive, and investors should be cautious when examining managers’ claims in this area, given the tendency to overstate the number of genuinely bilateral or off-market deals.
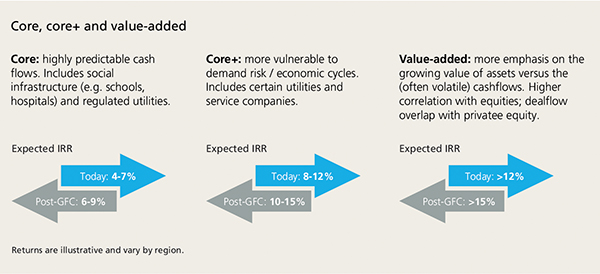
While the late stage of the cycle has compressed returns in traditional infrastructure sectors, it has also increased the tensions between certain key traits that investors wish to obtain from real assets, such as “returns” vs “diversification”. While many asset managers may – and do – continue to deliver the desired numbers by creeping towards the value-add end of the spectrum, they may also increase sensitivity to cyclical risks in doing so. For those prioritising diversification from equities, boring may still be beautiful, even if it doesn’t deliver 8-10%.
Figure 1: Infrastructure returns – then and now

In addition, many asset owners are concerned about alignment of interest with their managers, suspecting that open end fund managers may tend to focus on NAV values rather than long-term performance, while closed end fund managers may be too expensive and short in duration.
In short, while there is a very strong case supporting today’s larger allocations to infrastructure – and to real assets more broadly, implementation represents the most critical challenge. Theory and reality are not always in unison.
With implementation in mind, this article presents a brief case study from a recent LGPS infrastructure search. As well as outlining the key aspects of this search, the example illustrates one way in which LGPS are already leveraging the benefits of pooling even while still acting independently. Such negotiations, as well as various methods of informal partnership between two or more LGPS funds, have proved to be very popular for private market investments during the past 18 months – the ongoing interim phase between the initial formation of the pools and the maturation of their capability.
Case Study: Unlisted Infrastructure Manager Search, UK LGPS
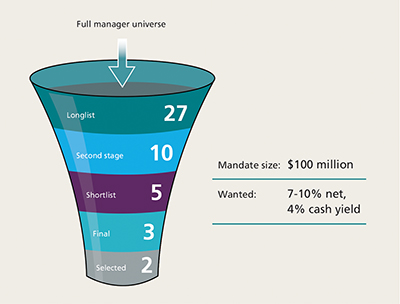
In 2017, a UK LGPS investor engaged bfinance to conduct a search for one or two private infrastructure managers, with a mandate of approximately $100 million. The key return objectives: 7-10% net performance, including a 4% cash yield.
This search began with a detailed review of the institution’s existing infrastructure holdings, coupled with an analysis of the most attractive current opportunities in the infrastructure landscape based on pricing, size, inflation-hedging and more. This focus on complementing existing exposures rather than analysing in absolute terms continued throughout the process.
The conclusions of the initial review were used to design a tailored set of parameters for an open procurement. Those terms included a willingness to consider non-OECD exposure of up to 40%, although the managers that were ultimately selected did not offer non-OECD investments: one was a US value-added manager, the other European core/core-plus.
Figure 2: Identifying the successful managers

The fee negotiations during this search were rather interesting, particularly in an LGPS context. We negotiated a bespoke fee sleeve for the selected managers, enabling the investor to benefit from fee discounts (commensurate with the scale of the aggregated mandates) if fellow LGPS make commitments to them. Importantly, these conditions were not restricted to members of the same investment pool, although that approach was initially suggested. Upon further discussion, the managers agreed to broaden the arrangement to include any UK LGPS regardless of which pool they are in. Two other LGPS funds have subsequently decided to allocate to one of these managers, resulting in savings to the original investor.
Fees proved to be a critical aspect of this search for other reasons too. Specifically, the investor wished to avoid paying fees on committed capital – a view which did not fit well with one of their preferred managers.
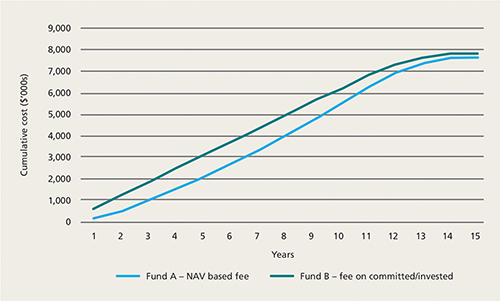
In order to provide a fairer basis for assessment, bfinance modelled the management fee leakage of two different 15-year funds. Figure 3 illustrates a pure management fee-only comparison, with “Fund B” charging a 1.25% management fee on all committed and invested capital while “Fund A” charges a blended management fee of 0.90% based on NAV, with NAV growth assumed at 6% per year. In both cases a 4-year divestment programme is assumed, with NAV/invested capital declining by 25%, 33%, 50% and 100% from years 12-15 respectively. The analysis illustrated that, assuming target returns are met, overall management fees paid to Fund A and Fund B would be broadly similar in practice.
Figure 3: Fixed management fees versus NAV-based management fee for two funds ($50 million commitment)

Source: bfinance analysis. Management fees only; does not include performance fee or any other costs
In addition, investors should consider performance fees, hurdle rates, catch-ups and other distinctions. Often these elements can outweigh the impact of a management fee structure. After negotiations with the relevant managers, the investor decided to pay management fees on committed and invested capital, concluding that the absolute fee leakage should be the priority.
Looking ahead: LGPS and infrastructure implementation
Today, the different pools are at very different stages in terms of their implementation for the key private market asset classes, infrastructure included. Some have already established teams of people dedicated to illiquid investments; others are dealing with public markets first, with private markets due to follow in a year or more. Some are facing a smoother path towards integration than others, particularly in the more complex and challenging asset classes. For now, it seems, more informal, innovative or ad hoc styles of collaboration between LGPS funds remain popular for private market investments, either as a prelude to pooling activity or as a complementary process. We look forward to seeing how the picture evolves during the coming years, and supporting LGPS funds through the journey.
More Related Content...
|
|
|


