Cashflow-driven investing: why a global and active approach matters
Written By:

|
Soraya Kazziha |

|
Michael Burns |
How should cashflow-driven investment be brought into action? Soraya Kazziha and Michael Burns of PIMCO explore the merits of sterling denominated assets versus global assets, and whether an active or passive approach should be employed
In a recent article in this magazine, we warned that the generally underfunded and increasingly cash flow-negative UK defined benefit (DB) pension sector could see its funding status challenged, especially in the present late cycle environment. We argued that a cashflow-driven investment (CDI) approach could be a solution to help meet liability payouts with a high degree of certainty.
Let’s now roll up our sleeves and explore how CDI could be brought into action. Should schemes solely focus on sterling denominated assets? Should portfolios be managed actively?
UK or global?
In an ideal world, a CDI portfolio would be void of currency risk and foreign interest rate risk. However, the relatively limited size of the UK investment-grade corporate bond market would make it rather challenging to construct a purely domestic CDI portfolio because:
- 1. A smaller opportunity set would likely lead to a less-diversified portfolio, which in turn could increase its potential default exposure under certain scenarios.
- 2. A lower yield (relative to the higher yield available in other countries) would translate into less coverage of future liability cashflows for the same capital commitment.
- 3. More limited liquidity may translate into higher transaction costs and therefore reduce the amount of liability cashflows covered for a given capital commitment. It would also make future adjustments to the CDI portfolio more challenging.
- 4. A significant uptake of CDI strategies within the UK DB community could be disruptive, given the modest size of the UK IG corporate bond market (around GBP 500 billion), relative to the size of the UK DB pension industry (around GBP 2 trillion).
A passive buy-and-hold approach in the context of CDI may at first glance sound appealing due to its implementation simplicity. However, as discussed in our previous article, cashflow negativity increases a scheme’s vulnerability to portfolio impairments, which in the case of CDI would be due to permanent default losses. Such losses could be exacerbated by a passive buy-and-hold investment strategy. However, this risk could be mitigated by adjusting the cash flows of a CDI portfolio at inception (e.g. using Moody’s cumulative losses by rating). To assess the efficiency of a passive CDI approach, we backtested the performance of a simple hypothetical default-adjusted, buy-and-hold UK IG corporate bond market CDI portfolio strategy initiated monthly between January 2004 and December 2008 (see Figure 1, over, for results).
Our backtest methodology was as follows: At the beginning of each month over the 2004 to 2008 period, we solve for the budget-minimising1 IG corporate bond portfolio2 (within the ICE Merrill Lynch USD corporate bond universe3), which matches on a default-adjusted basis4 a specified 12-year annual liability stream (in USD). The portfolio is held over the duration of the 12-year liability stream, during which time liability cashflows are met primarily with portfolio cashflows. The portfolio is self-funded – i.e., a cashflow shortfall in any given year is funded by selling assets from the remaining portfolio on a pro-rata basis. Equally, any surplus is re-invested.
At the end of the 12-year period, we measure the difference between the realised cashflows and the expected (or liability) cashflows as an adjustment to the initial portfolio yield (YTM in the formula below). Then we solve for an annualised excess loss rate (el):
![]()
Where CFt projected is the portfolio expected default-adjusted cashflow in year t.
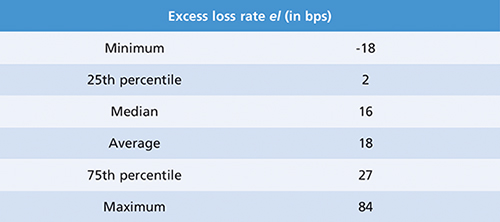
Intuitively, when the CDI portfolio delivers less (or more) cashflows than initially expected, this results in a positive or negative annual excess loss rate (el). The table above shows a summary of our test results.
Figure 1: Excess loss rate el of a hypothetical CDI portfolio strategy initiated monthly between January 2004 and December 2008

We found that over the observation period (60 portfolios initiated between January 2004 and December 2008), on average portfolios experienced higher losses than were expected at the outset, equivalent to 18 basis points (bps) per annum, with a median of 16 bps. In over 25% of the samples, annualised losses exceeded approximately 27 bps.
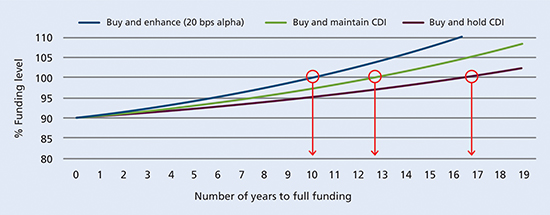
While an average annual excess loss of approximately 20 bps may not seem significant, the potential impact this would have had on a scheme over this period is surprisingly large. Figure 2 shows the impact on the expected path to full funding of the same cashflow-negative scheme that we illustrated in our previous article (4-5% in the first 10 years).
Figure 2: Funding Level Projection

Source: PIMCO – a hypothetical example for illustrative purposes only.
By applying the average excess losses estimated in the sample, we found the potential effect on the expected time to full funding of cash flow-negative scheme results in an additional four years, shifting the number of years required to achieve full funding from 13 (baseline) to 17 (passive CDI). This is comparable to the impact from a 25% equity drawdown.
We now contrast these results with a hypothetical actively-managed CDI portfolio, with an assumed symmetrical annual outperformance of 20 bps versus the baseline. In this case, we found that the expected time to full funding was accelerated by three years, from 13 to 10. In other words, the difference in the expected time to full funding between a passive CDI portfolio and an active portfolio with a modest alpha target of 20 bps can be highly significant: as much as seven years (17 versus 10) in our example.
Conclusion
Given the findings from our analysis above, we believe a globally-focused and actively-managed IG corporate portfolio and careful portfolio construction can help UK DB schemes better plan and meet future liabilities. There is, however, one further issue to bear in mind: foreign currency management – but we will leave this for the next and final article of our series.
Important Information
For professional investor use only.
PIMCO Europe Ltd (Company No. 2604517) and PIMCO Europe Ltd – Italy (Company No. 07533910969) are authorised and regulated by the Financial Conduct Authority (12 Endeavour Square, London E20 1JN) in the UK.
This material contains the opinions of the manager and such opinions are subject to change without notice. This material has been distributed for informational purposes only and should not be considered as investment advice or a recommendation of any particular security, strategy or investment product. Information contained herein has been obtained from sources believed to be reliable, but not guaranteed. No part of this material may be reproduced in any form, or referred to in any other publication, without express written permission. PIMCO is a trademark of Allianz Asset Management of America L.P. in the United States and throughout the world. ©2020, PIMCO.
1. We chose this simple approach because of its perceived appeal. However, we would recommend for various reasons a more careful portfolio construction.
2. Subject to maximum issuer concentration limit of 1.50% and sector concentration limits (40%)
3. Excluding callable and sinkable bonds
4. We apply the then prevailing Moody’s rating-dependent cumulative average default rates. Specifically, we bootstrap an annual default intensity and enforce a flat forward intensity at the point where term structure of cumulative annual defaults becomes flat.
More Related Content...
|
|
|