Multi-asset credit portfolio manager Damien McCann and risk and quantitative solutions specialist Joseph Roberts from Capital Group discuss how active...


Report
As government pressure to invest locally grows, we crunch the numbers on where LGPS funds are putting their money
In 2019, in his first speech since having been christened as the country’s new prime minister, Boris Johnson talked of a need to “level up across Britain” and expressing a desire to “answer the plea of the forgotten people and the left-behind towns” of the country.
This was further articulated in that year’s Conservative manifesto, making “levelling up” a key pillar of the Johnson administration – even renaming the Ministry of Housing, Communities and Local Government (MHCLG), the department nominally responsible for boosting local investment, the Department for Levelling Up, Housing and Communities (DLUHC).
And while we have cycled through several prime ministers and a change in governing party since then – with DLUHC becoming MHCLG once again when the Labour government came in in July 2024 – the theoretical principles of levelling up remain the same.
The LGPS is, of course, being seen as a more central cog in this campaign for growth with Fit for the Future requiring funds to set a target percentage allocation range for local investment projects.
As for what this local investment looks like in practice, infrastructure is being seen as an increasingly key area to invest in.
Now when considering this, it is crucial to note that typically the data does not involve spend on housing and regeneration projects (which is where a significant chunk of local investment spend goes to) but on broader projects like renewable energy, schools, utilities, and digital infrastructure.
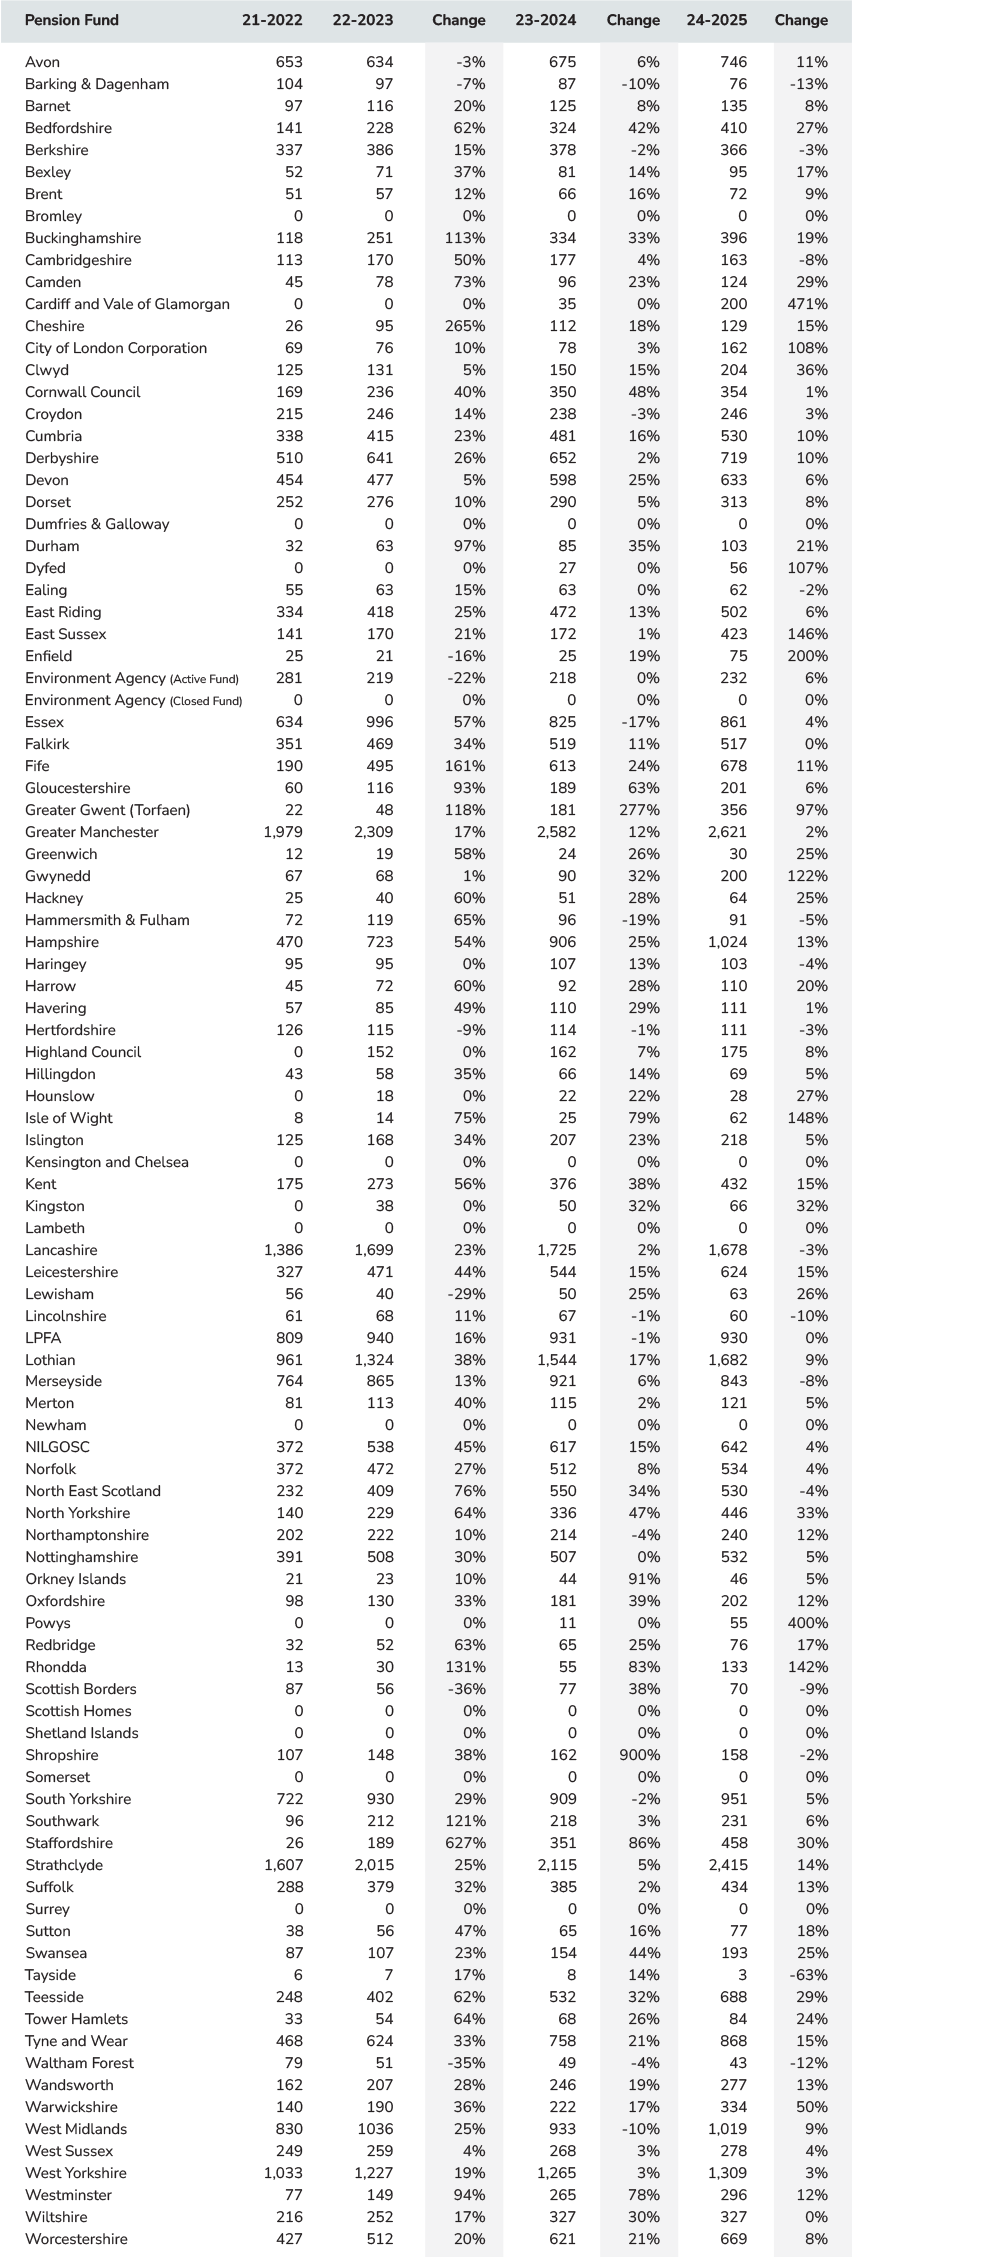
For the LGPS, it’s something that funds have been increasingly putting more money behind – growing by an average of 18% across all the funds in the UK between 2022 and 2025.
The most significant driver of this uptick came between the 2021/22 and 2022/23 financial years, which is also the last time the government had put forward any meaningful plans to push LGPS funds to invest locally.
Back in February 2022, just over a month before the end of the 2021/22 financial year, the government published a white paper in which it asked LGPS funds to set out plans for investing up to 5% of their assets in projects that support domestic initiatives.
Now, while the proposals set out in the white paper were never formally enacted, it does appear it was enough to result in an uptick in infrastructure – and by association local investment, growing by an average of 30% across the funds between 2021/22 and 2022/23.
There was then a notable slowdown, going from 30% to 12% between 2022/23 and 2023/24, and from 12% to 11% between 2023/24 and 2024/25. However, given the government’s recent proposals, another significant upturn in infrastructure spending growth between 2024/25 and 2025/26 would not come as a surprise.
Figure 1: Infrastructure 3-year average % (million)
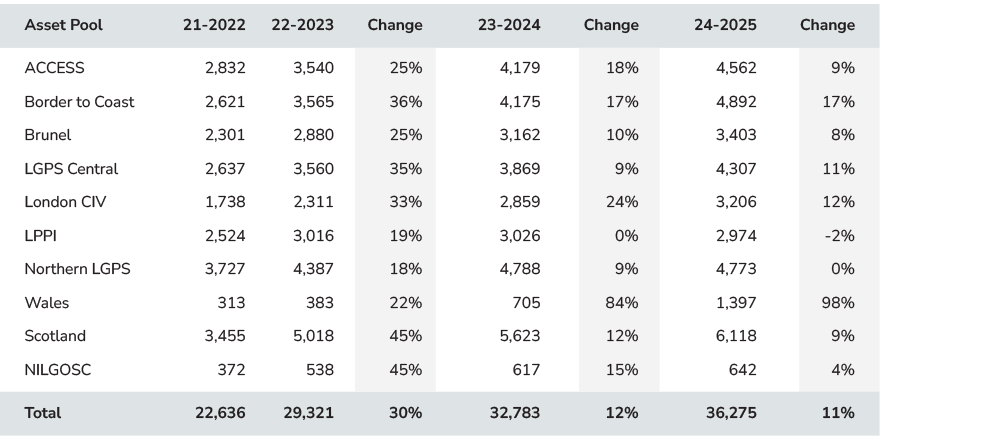
Source: Data as at Mar 25 | www.lapfdataservices.com
This pattern – a sharp rise then a notable slowdown – is consistent with what most of the pools have seen, though crucially not all.
Wales is the notable outlier there – not so much because of the growth seen between 2021/22 and 2022/23 (22% is nothing to be sniffed at) but how the growth trend continued since then.
All told, between 2022/23 and 2023/24, infrastructure spending rose by 84% from £383.4 million to £705.6 million, before going up by nearly 100% between 2023/24 and 2024/25 to £1.4 billion.
This is very much reflective of the performance of some of the individual funds, with the likes of Greater Gwent (Torfaen) and Rhondda seeing growth rates around the 100% mark over these two periods.
As for infrastructure investment by value, six funds surpassed the £1 billion mark – namely Hampshire (£1 billion), West Midlands (£1.02 billion), West Yorkshire (£1.3 billion), Lothian (£1.68 billion), Strathclyde (£2.42 billion), and Greater Manchester (£2.62 billion).
Figure 2: Fixed income 3-year average % (million)
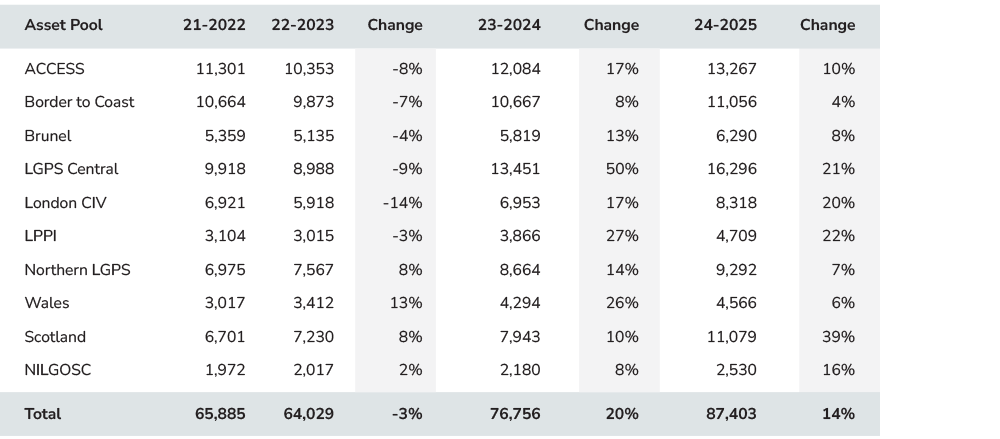
Source: Data as at Mar 25 | www.lapfdataservices.com
The LGPS, meanwhile, appears to be following the trend of most of the market of a steady return back to the fixed income space following a steep drop off between 2021/22 and 2022/23.
Why was there a steep drop in exposure to fixed income between these two financial years? Well, the answer is most likely found in what happened 23 September 2022 – the day of the infamous Truss/Kwarteng mini budget.
The budget caused a liability-driven investment (LDI) crisis by triggering a rapid and unprecedented surge in government bond yields, forcing leveraged LDI portfolios to meet margin calls, forcing the fire sale of these bonds as the market scrambled to meet liquidity demands.
Now, while the LGPS did have more limited exposure to LDIs compared to most, there was still a drop in exposure to these markets. According to the Scheme Advisory Board, bonds fell from £53.2 billion to £44.1 billion over this period.
Figure 3: Total assets 3-year average % (million)
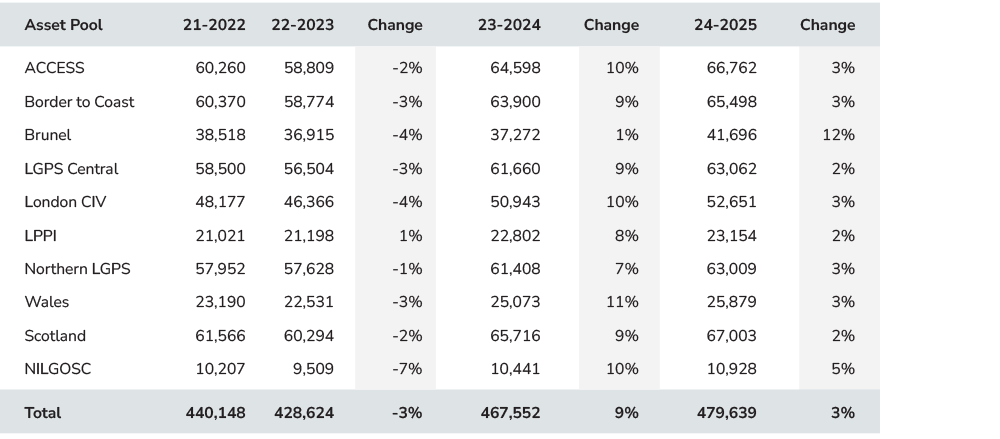
Source: Data as at Mar 25 | www.lapfdataservices.com
And this is reflected in the funds’ exposure during this time period with well over two-thirds seeing a drop in allocations to fixed income over this time period, with falls of well over 50% from some funds.
All told, there was a 3% drop across all the funds between 2021/22 and 2022/23 – falling from £65.9 billion to £64 billion.
Of the pools, only the Wales Pension Partnership and Northern LGPS – driven almost entirely by Greater Manchester’s 23% increase – saw an uptick in fixed income allocations.
There was, on the face of it, a fairly quick return to the fixed income space following this drop off – growing from £64 billion to £76.8 billion.
Allocations to the fixed income market have now well surpassed what they were in 2021/22, hitting £87.4 billion in 2024/25. And, given the uncertainty currently being seen in global markets, I for one can’t see this growth trend changing any time soon.
With fixed income allocations now well above their pre-crisis levels and showing little sign of slowing, the LGPS finds itself in a position of considerable strength heading into the next cycle.
This growing financial firepower, combined with increasing government pressure to back domestic growth initiatives, suggests that infrastructure investment – already up 18% on average since 2022, with standout performers like Wales nearly doubling its spend year-on-year – looks set to accelerate further in the years ahead.
Fixed income 3-year average by pension fund
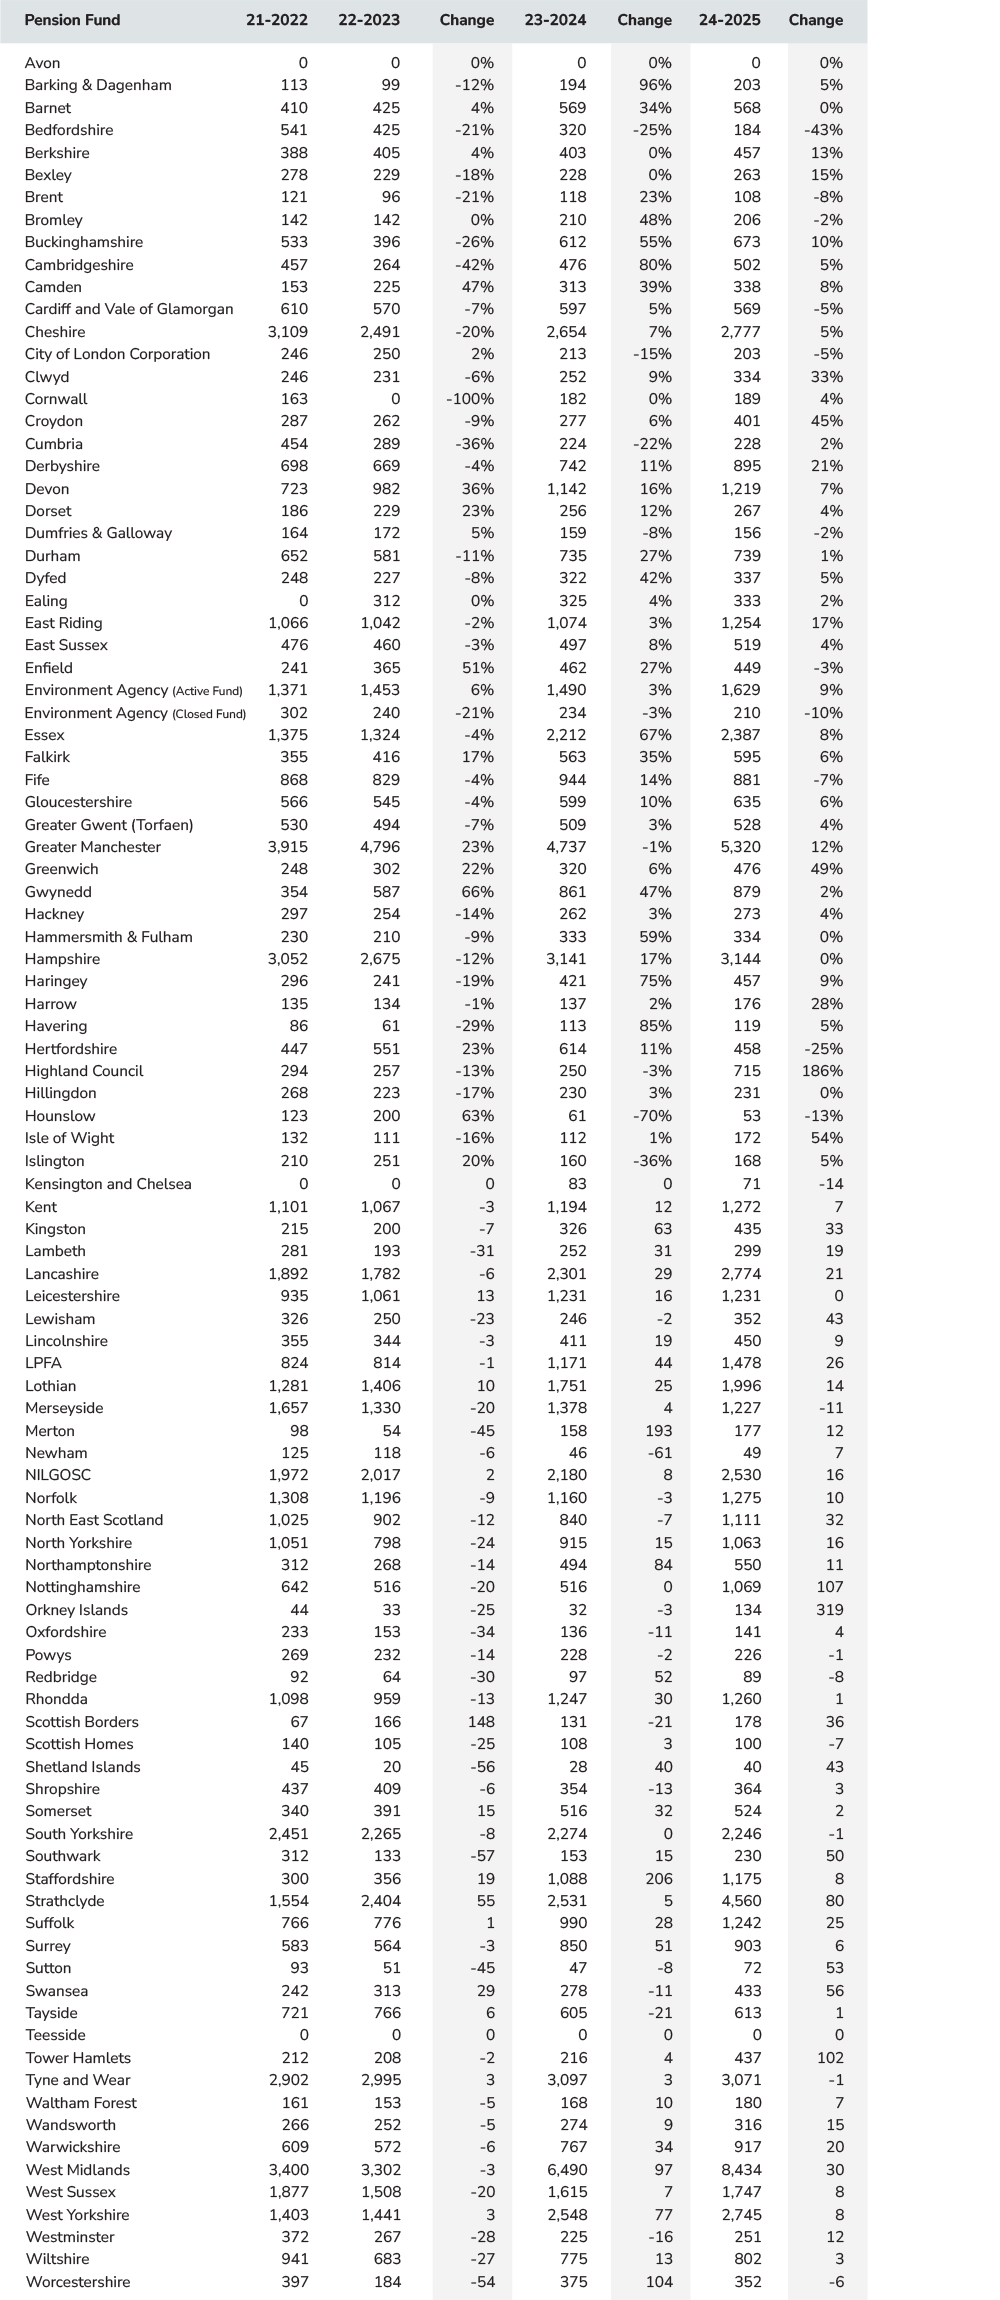
Infrastructure 3-year average by pension fund
|
|
|